Greenland - Where the Ice Meets the Ocean will appear in this years Atlas of Design - Volume 5 release. Order your copy today @ https://atlasofdesign.org .
The origins of this map began in November 2019, during a #30daymapchallenge that was conceived by Topi Tjukanov (@tjukanov) on Twitter. I joined this challenge with two objectives in mind: push myself outside of my usual work habits, and experiment with visualizing geospatial data in a different tone - quick, lively, colorful maps that would expand my creative palette. As my daughter so poignantly stated, “Dad is making art with his maps again.”
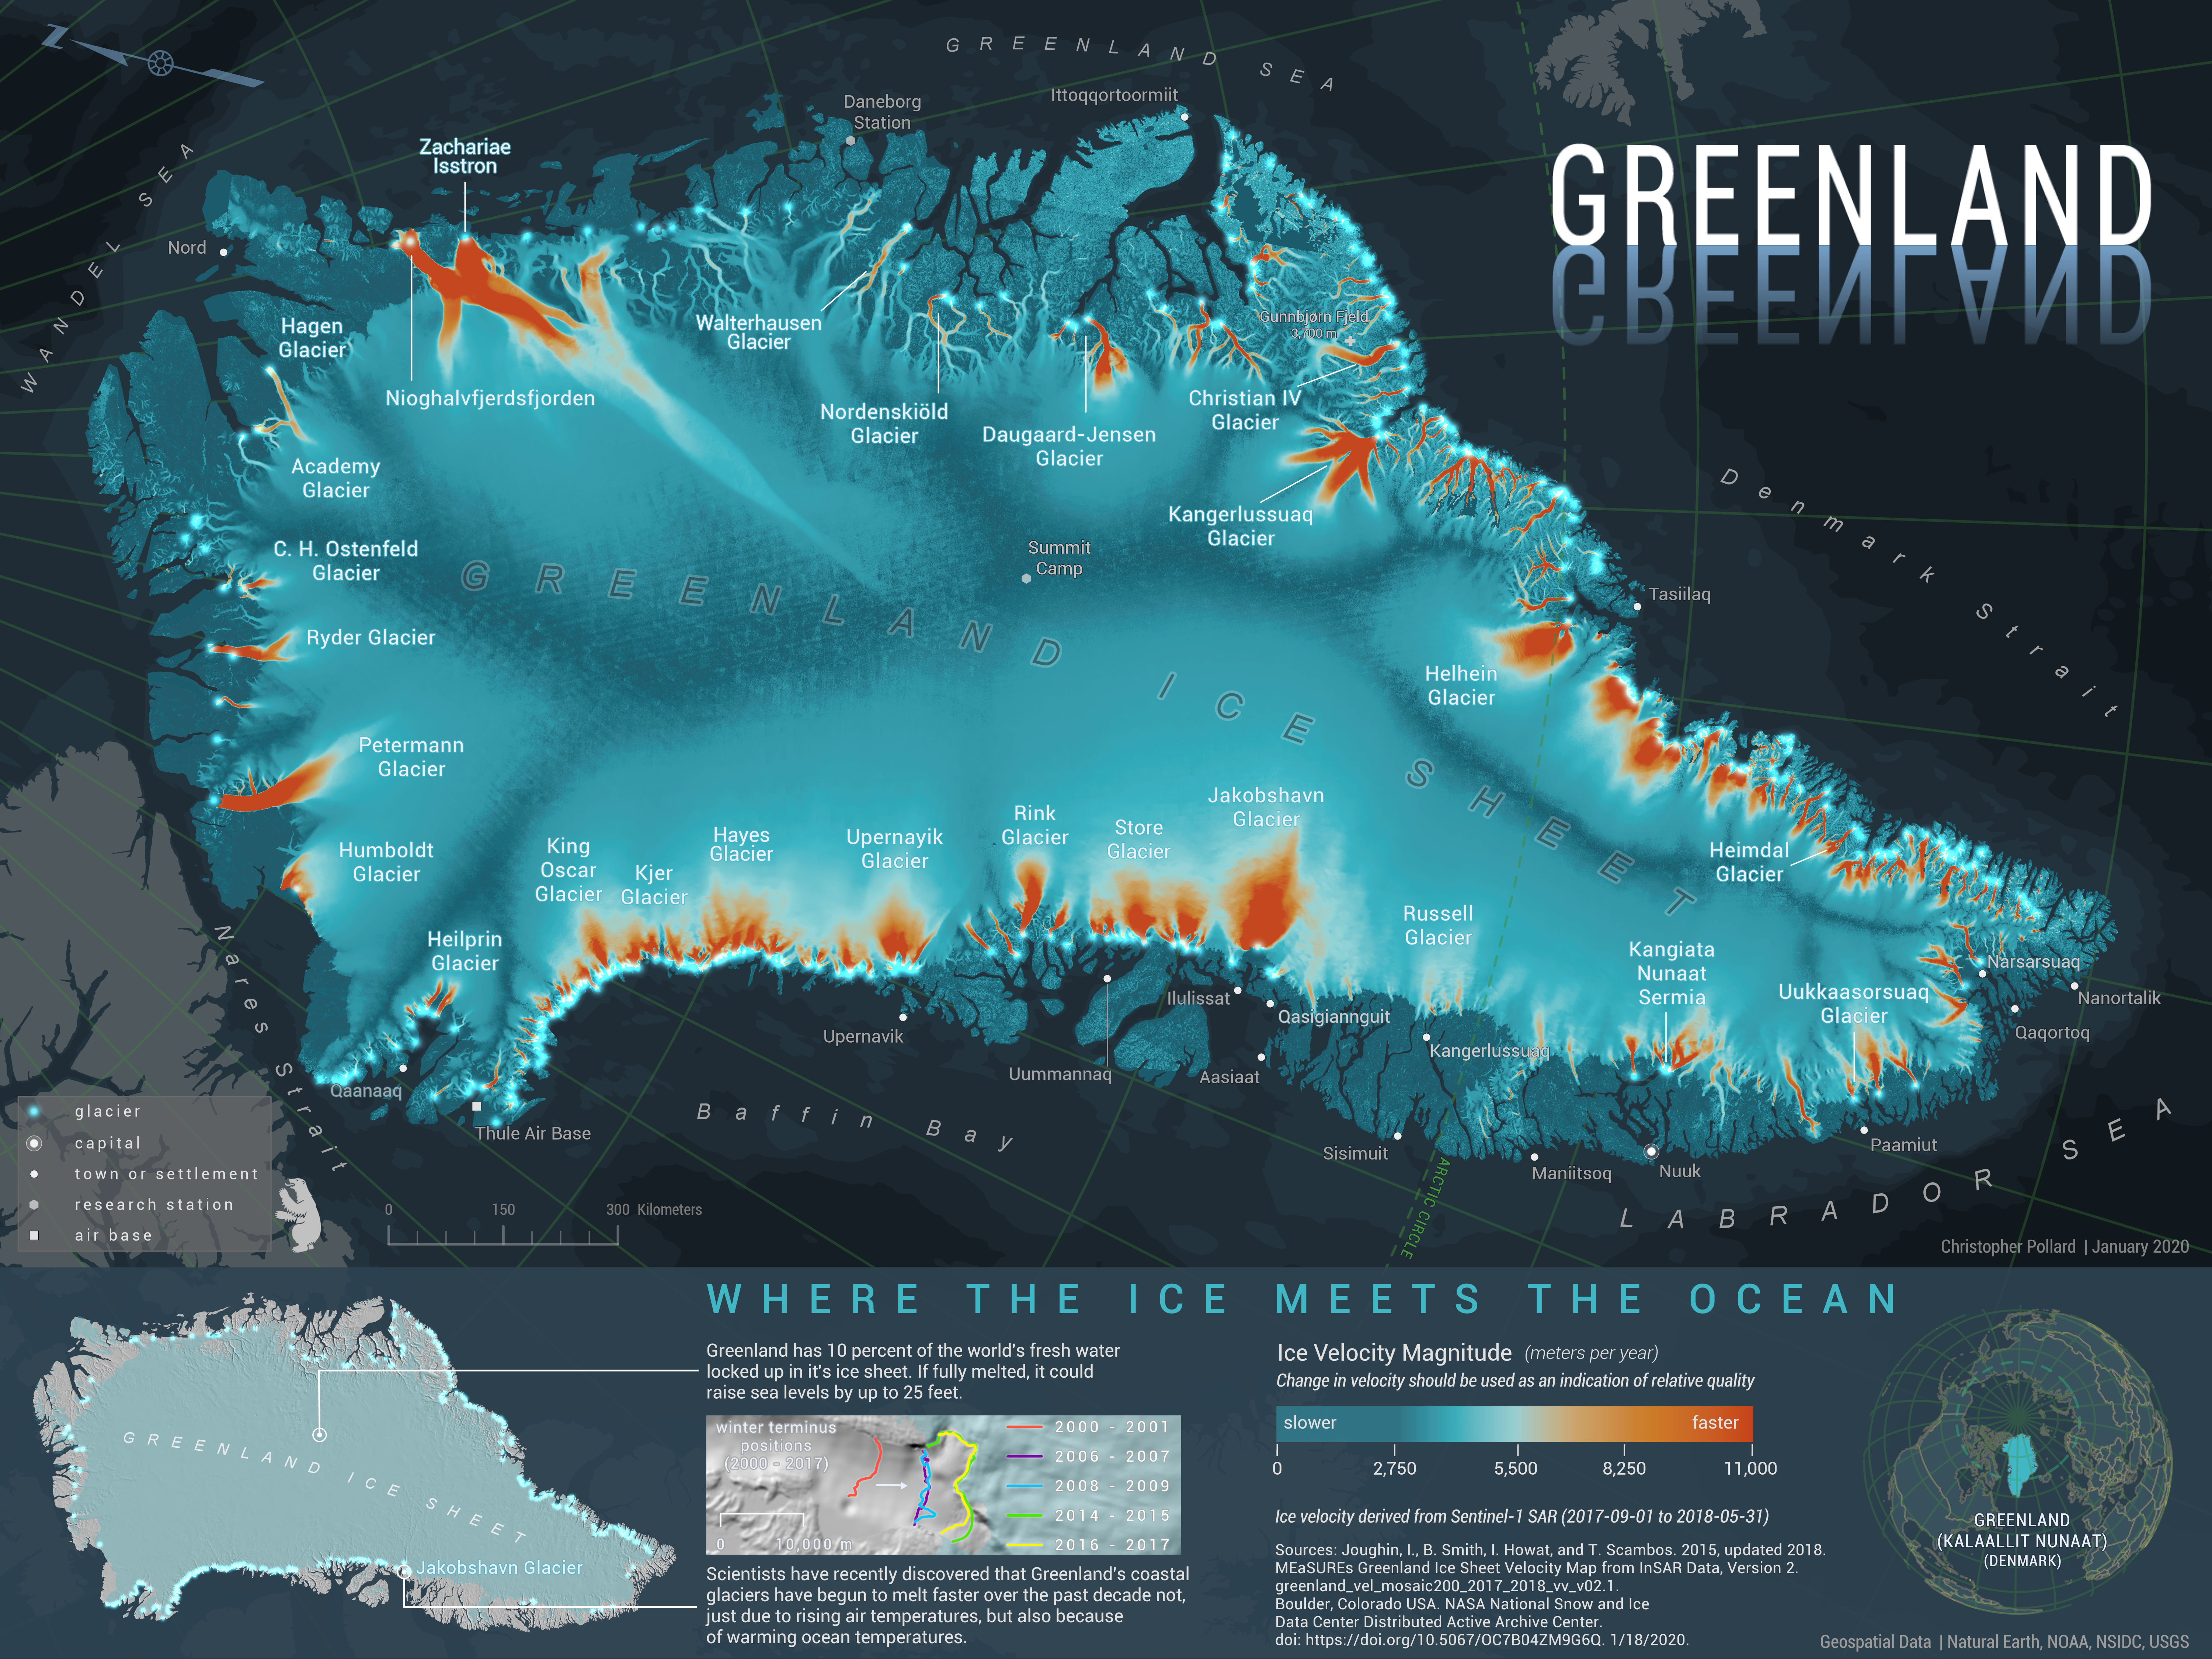
The original map was conceptually more straightforward, in that it simply depicted the dramatic coastline, along with a few sparse towns. However, what I most enjoyed designing was the gradient-like reflection in the title. I wanted it to feel like the title was melting into the ocean, which, according to scientific evidence, is actually happening to the coastal glaciers on Greenland. Another feature that I was drawn to was the horizontal position of Greenland, as it is a visual that we don’t normally see.
The map received some traction on Twitter, and I even received an email from a Dutch researcher, who was impressed with my map, calling the design “beautiful.” These reactions impacted my decision to keep building upon what I started, but something was missing. I knew I needed some compelling scientific data about ice melt to tell the visual story I had imagined.
I started to explore NSIDC’s datasets and discovered the land ice velocity imagery. I knew right away that this was what I was seeking. I altered the map’s focus to highlight the change of ice velocity occurring at the intersection of the coastal glaciers and the ocean. Initially, I began using softer shades of blue and white to represent dirty melting ice, but I wanted something more striking. With the help of my daughter, we arrived at a teal- to- orange color ramp that helped define and accent the change in velocity. This change can be seen clearly where the glaciers meet the ocean.
Finally, it was time to label the glaciers and other features. Although challenging and very time-consuming, the task of figuring out label placement proved to be the most rewarding part.
And in the end, our goal as mapmakers is to combine accurate data features with a stunning piece of artwork, to create a visual feast for the eyes.
Get In Touch
If you look you might be able to find me.